
El Método Taguchi, la Ingeniería Robusta y el Diseño de Experimentos
14 pasos para el Diseño de Experimientos
- Se define el objetivo del análisis, en cuanto al alcance, los costos y el fin.
- Se conforma un equipo de trabajo para el proyecto de mejora mediante DOE.
- Se especifica concretamente el problema. Se puede utilizar alguna técnica de análisis de problemas, como los Diagramas de Ishikawa o Pareto, cuyos datos se pueden obtener de un brainstorming.
- Se evalúa el entorno técnico y humano.
- Se define y valida el sistema de medida.
- Se construye el DOE, mediante ensayos de factibilidad y procedimientos específicos de trabajo.
- Se preparan los ensayos.
- Se ejecutan los ensayos.
- Se miden los ensayos.
- Se analizan los resultados, discriminando señal de ruido, y se realiza el modelado.
- Se eligen los valores óptimos de los parámetros.
- Se realizan nuevas experiencias para confirmar.
- Se informan los resultados.
- Se comparan los progresos obtenidos con los objetivos planteados en los primeros puntos.
La Función de Pérdida de la Calidad de Taguchi
 |
| Función de Pérdida de Taguchi |
 |
|
Enfoque tradicional del concepto de la tolerancia
(dentro de la tolerancia hay cero pérdida) |
Gen’ichi Taguchi, statistician and Japanese engineer, was one of the most important person in the development of statistical techniques for the improvement of the manufacturing processes. Taguchi was the main propeller of what is known as Robust Engineering, a method that aims at a reduction in the variability of the outputs of the processes. Historically, it was sought to reduce the variability of processes by eliminating the sources of noise that produced it, something quite utopian and complex to perform. The Taguchi Method, on the other hand, is based on eliminating or minimizing the effects of noise, not noise itself.
The variability of the processes are caused by parameters that can not be controlled. These parameters are known as process noises. The Design of Experiments (DOE) is a discipline that allows us to analyze the effects of noise on processes in a quantitative way. This cause-effect relationship is modeled by a functional relationship, which is achieved with experimental help. The information obtained empirically allows to understand the ‘weight’ of each source of noise on the variability of the process. Many noise parameters may have significant effects, others slight, and others negligible.
Taguchi was also the creator of the concept of quality engineering, which includes quality control online and offline (on-line and off-line). The on-line control contemplates all activity of control and maintenance of processes, generally supported by the use of control charts. Offline control is a somewhat more innovative concept and is used in the design stage of the products and processes involved. The technique used in this case is the DOE.
14 Steps to Designing Experiments
The DOE is based on empirical data. These can be obtained by following the following fundamental steps:
– The objective of the analysis is defined, in terms of scope, costs and purpose.
– A work team is formed for the DOE improvement project.
– The problem is specifically specified. Some techniques of problem analysis can be used, such as the Ishikawa or Pareto Diagrams, whose data can be obtained from a brainstorming.
– The technical and human environment is evaluated.
– The measuring system is defined and validated.
– The DOE is constructed, through feasibility tests and specific work procedures.
– The tests are prepared.
– Tests are run.
– The tests are measured.
– The results are analyzed, discriminating noise signal, and the modeling is performed.
– The optimum values of the parameters are chosen.
– New experiences are made to confirm.
– The results are reported.
– The progress achieved is compared with the objectives set out in the first points.
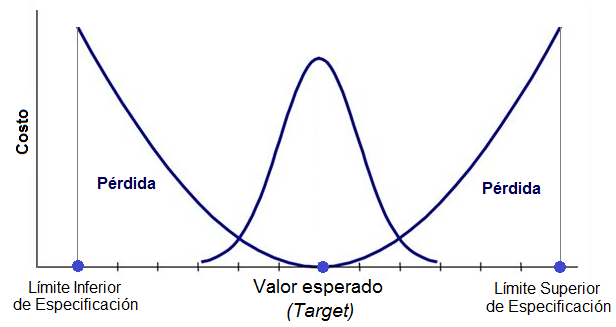
The Taguchi Quality Loss Function
The Taguchi Quality Loss Function allows us to calculate and quantify how far we are away from the expected (target) value of a particular parameter. This valuation is done in monetary units. The further away the expected value parameter (target or target), the greater the associated monetary loss that is transferred to the customer.
Taguchi Loss Function
This growth is exponential and is defined by the following equation:
L (x) = k · (x – T) ²
Where L (x) is the result of the loss function, x the value of the analyzed characteristic, T its expected value and k a conversion constant to monetary units. Therefore, if L = 0, we are facing the expected quality. As L moves away from 0, in either direction, we are losing quality and increasing costs. There are tolerance limits, where L takes a maximum allowed value: the Lower Limit of Specification and the Upper Limit of Specification. There is a difference with the traditional approach of tolerance, which considers that there is no loss within the limits.
Traditional approach of the concept of tolerance
(Within the tolerance there is zero loss)
[:]