
QFD y la Casa de la Calidad
- Identificar lo que el cliente desea.
- Identificar cómo el producto satisfará los deseos del cliente.
- Relacionar los deseos del cliente con los cómo del producto.
- Identificar las relaciones entre los cómo de la empresa.
- Desarrollar clasificaciones de la importancia.
- Evaluar los productos de la competencia.
- Determinar los atributos técnicos deseables.

|
Partes que componen la Casa de la Calidad, identificadas
con colores y números diferentes
|
- En la zona 3 se encuentran listadas las necesidades del cliente (lo que el cliente quiere de nuestro producto), las cuales se encuentran ponderadas por nivel de importancia en la columna que conforma la zona 4.
- En la zona 2 aparece todo lo que nosotros podemos hacer en términos de atributos del producto para satisfacer al cliente.
- En la zona 5 se encuentran relacionadas las necesidades del cliente (de la zona 3) con los atributos que podemos conseguir (de la zona 5). Aquí se establecen generalmente tres niveles de correlación: relación alta, media o baja, identificándose de igual manera que en otros diagramas de matriz(pueden utilizarse otros símbolos, nosotros elegimos mantener el mismo criterio). Ver símbolos más abajo.
- En la zona 1 (el «techo» de la casa) se vinculan entre sí los atributos posibles, también mediante grados de correlación.
- En función de los grados de relación que aparecen en la zona 5 y la ponderación de las necesidades del cliente se obtienen los resultados de importancia de cada atributo en función de las necesidades del cliente. Esto aparece en la zona 7. Esto quedará más claro en el ejemplo.
- La zona 6 se utiliza para compararnos con la competencia: en qué grado la competencia cumple con las necesidades del cliente.
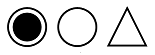 |
| Con estos símbolos suele representarse el grado de vinculación entre aspectos. De izquierda a derecha: relación fuerte o alta, relación media y relación débil o baja |
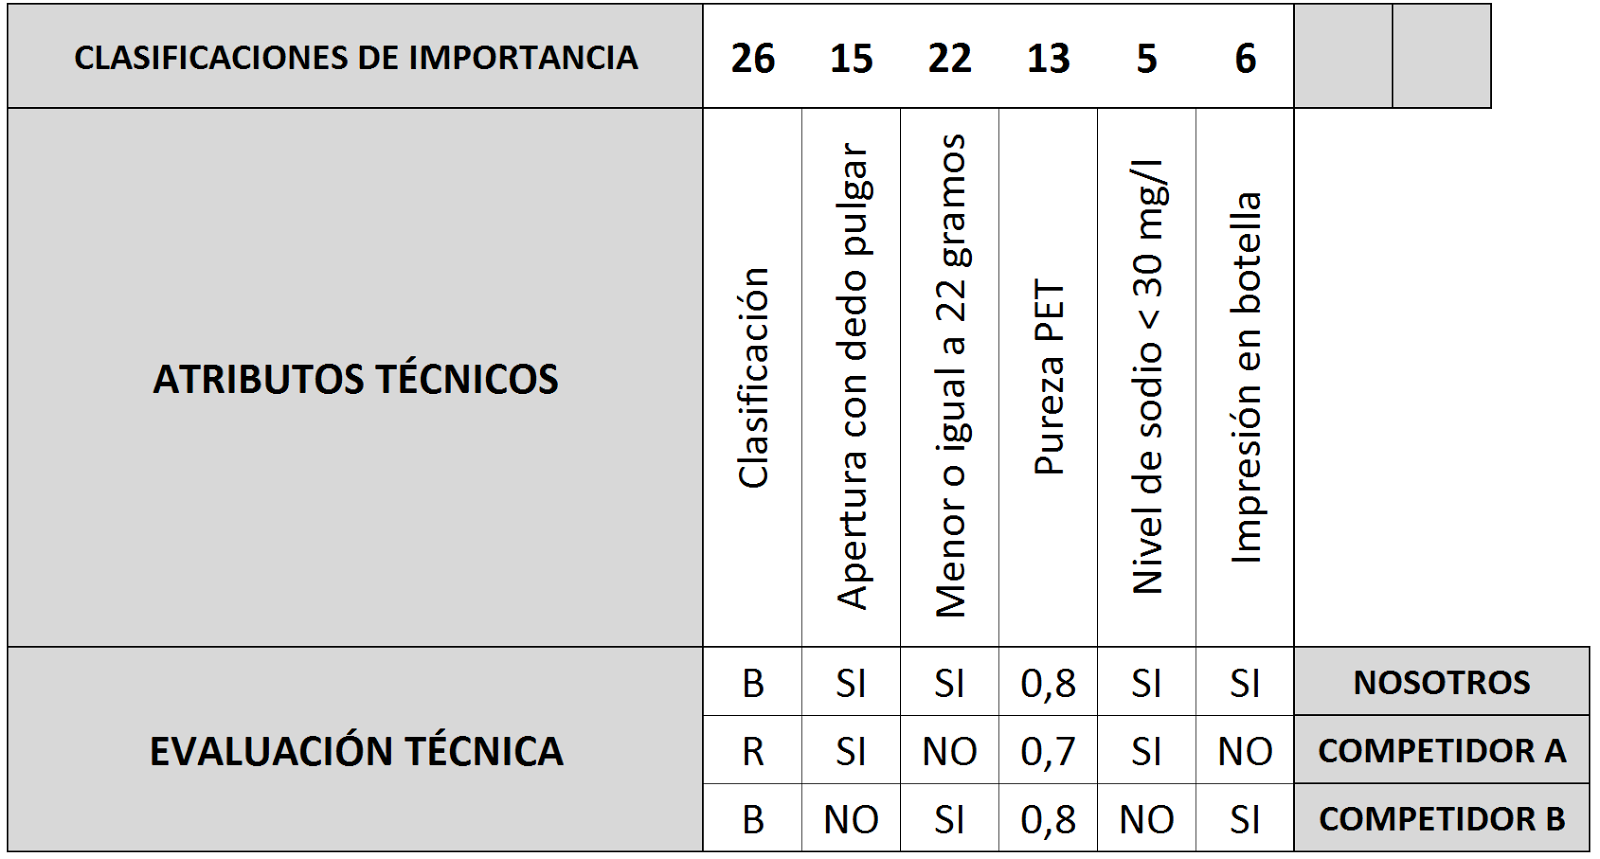
- Las zonas 8 y 9 son utilizadas para definir y evaluar los atributos técnicos que corresponden a la implementación real de la solución.
- Que sea fácil de asir
- Que la tapa sea sencilla de abrir y cerrar (para ser consumida durante la realización de una actividad física)
- Que la botella sea ligera y fácil de comprimir y ser desechada
- Que sea reciclable
- Que pueda ser consumida por cualquier persona
- Diseño ergonómico
- Sistema de apertura mediante pico
- Peso reducido
- Fabricación íntegra en material PET
- Bajo sodio y libre de azúcares
- Etiqueta impresa sobre el cuerpo de la botella


Among the many tools that are known for improving the design processes, we highlight a particular method: Quality Function Deployment (QFD). QFD is a powerful and integral method of quality management in the design stage of a product (service). Today is one of the most used tools within complex management systems operating under Six Sigma or Toyota Production System, just to cite examples. It combines techniques of prioritization, competitive strategy, market research and definition of technical aspects.
What does it consist of? QFD is a methodology whose main objective is to capture what the customer wants and translate it into technical design solutions. The term «deployment» appears as QFD identifies the customer’s need and tells us where to «deploy» design efforts.
Undoubtedly, the House of Quality (HOQ, by the initials of House of Quality) is the most commonly used implementation tool in QFD. They should not be confused with each other. HOQ is just one way to implement QFD, to put it into practice, but it is not QFD. Its creator is the Japanese Yoji Akao, who developed it in the beginning of the seventies. It is a graphical method, which integrates information of diverse aspects, as demanded by the definition of QDF: weighted customer specifications, technical attributes and competitive evaluation. The final graph resembles a house with a gabled roof, hence its name.
Construction of the House of Quality Chart
We will analyze how the logical arming of the graph is performed through an example, where we will identify each of the parts that make up the HOQ and how the data should be interpreted and dumped. Before proceeding in this direction, we propose the seven basic steps for the arming of the graph (1):
1.- Identify what the customer wants.
2.- Identify how the product will satisfy the customer’s wishes.
3.- Relate the customer’s wishes to the how of the product.
4.- Identify the relationships between the how of the company.
5.- Develop classifications of importance.
6.- Evaluate competitive products.
7.- Determine desirable technical attributes.
Let’s see now how the general structure of the chart is:
Parts that make up the House of Quality, identified
With different colors and numbers
To understand it better, we will identify areas in a more intuitive way:
In zone 3 are listed the needs of the customer (what the customer wants of our product), which are weighted by importance level in the column that makes up zone 4.
In Zone 2 there is everything we can do in terms of product attributes to satisfy the customer.
In zone 5 are related the needs of the client (from zone 3) with the attributes that we can get (from zone 5). Here, three levels of correlation are generally established: high, medium or low relation, being identified in the same way as in other matrix diagrams (other symbols can be used, we choose to maintain the same criterion). See symbols below.
In zone 1 (the «roof» of the house) the possible attributes are linked together, also by degrees of correlation.
Depending on the degree of relationship that appears in zone 5 and the weighting of the client’s needs, the results of importance of each attribute are obtained according to the needs of the client. This appears in zone 7. This will become clearer in the example.
Zone 6 is used to compare with the competition: to what degree the competition meets the needs of the customer.
With these symbols, the degree of link between aspects is usually represented.
Left to right: strong or high relationship, average ratio and weak or low ratio
Zones 8 and 9 are used to define and evaluate the technical attributes that correspond to the actual implementation of the solution.
Nothing better than an example to better understand the operation of a method.
Example: Our soft drinks factory wants to enter the mineral water market, where there are already two well defined competitors (let’s call them A and B for practicality). The idea is to start with small format (500ml). Through a market study was able to determine what the client expects a mineral water.
Customer needs:
Make it easy to grab
That the lid is simple to open and close (to be consumed during the performance of a physical activity)
Make the bottle light and easy to compress and discard
Make it recyclable
That can be consumed

What attributes can we achieve?
Ergonomic Design
Peak opening system
Reduced weight
Manufactured entirely in PET material
Low sodium and sugar free
Label printed on the body of the bottle
Let’s turn the data on the chart:

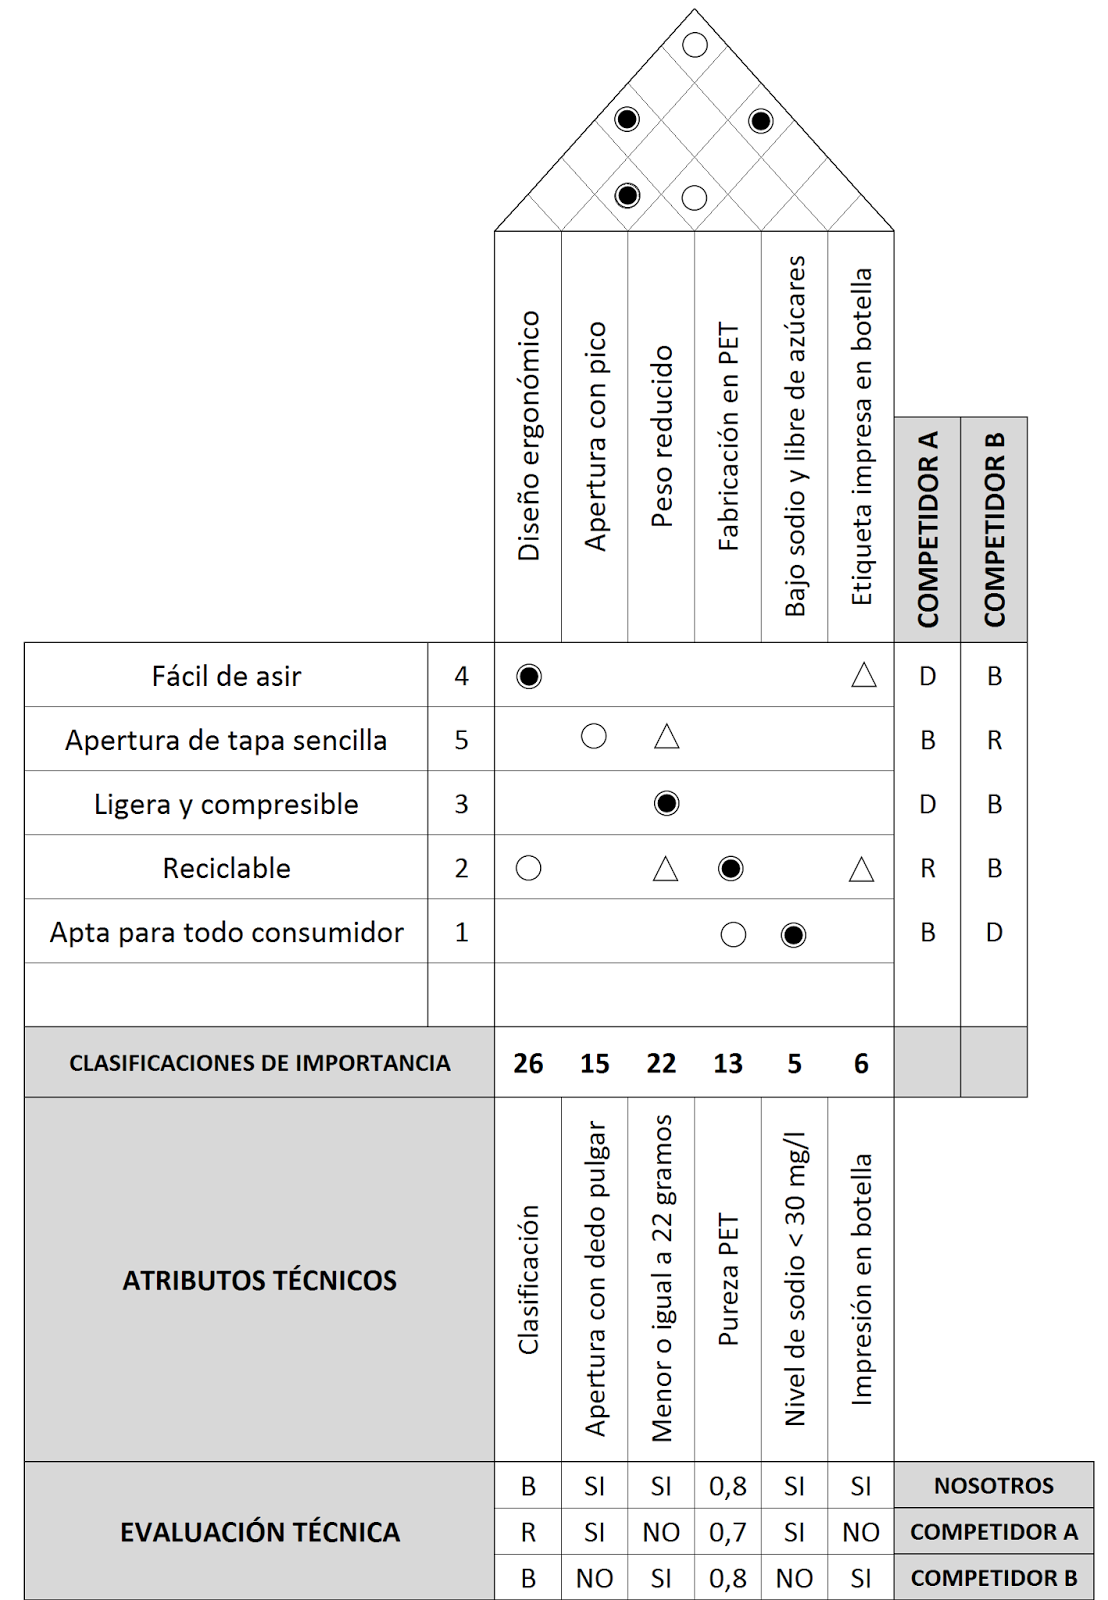
Here we can see how the customer’s needs are linked (to the left) with the attributes that we can give to our product (above). The relationship will be expressed by the symbols mentioned above. Bear in mind that each need is weighted by importance (as determined in the market study). What the customer asks for is that the lid is easy to open (weight 5). The least important is that water is suitable for all types of consumers (ie people with chronic diseases such as diabetes or high blood pressure).
Another important fact that appears is how competitors respond to the customer’s need. Three possible classifications are taken into account:
B = Good answer
R = regular response
D = Poor response
This information is dumped in the columns to the right of the chart.
In addition to the relationship between customer need and attributes, it is important to know what degree of dependency exists between attributes. This will allow us to know the level of compatibility of the technical solution. Let’s look at the example:
For example, here we can see that there is a relationship between the possibility of designing the bottle in an ergonomic format with the material of manufacture (PET). Or, that the reduced weight of the whole bottle is affected in some way with the type of quick-release lid.

So far we have seen cross-relations, but we do not yet know which attribute is most important to fulfill. For this we use the weighting of the needs and their degree of relation with the attributes. For practical purposes, the high ratios will be quantified with a 5, averages with a 3 and the lows with a 1.

If we analyze the attribute «Manufacture in PET» we have high relation (value 5) with the need that is recyclable (weighting 2) and average (value 3) that is suitable for all consumers (weighting 1). Let us calculate the value of this attribute = (5×2) + (3×1) = 13
In the present example, the ergonomic design attribute is the most important.
Then we move on to the stage of technical implementation, our degree of compliance with the attributes and how the competency also fulfills them:
We already have all the information necessary to assemble the complete chart:
In summary …
QFD is a powerful method that integrally links several aspects that must be taken into the design of a new product or service. What the customer expects, what we can give ourselves, how we implement it and how the competition handles it. It allows us to determine where to put (deploy) the forces to obtain what we want with the minimum resources and with a high level of customer satisfaction. It is commonly used in applications where strategic planning is required: hoshin hanri or Six Sigma.
HOQ is one of the most practical and representative ways to perform a QFD. It is simple to understand, it contains all the information in a single graph and can adapt to practically any need.
[:]