
Is my process under control? Control charts and how to detect detours
Statistical Quality Control is a powerful tool to analyze how our process is working. Although its application is usually associated with manufacturing processes, it can be used in many applications. One of the great pillars of Total Quality Management (TQM) is compliance with specifications. Statistical Quality Control or Statistical Process Control (SPC) allows us to know if the result of any process under analysis complies with what is specified or not. Without greater statistical depth or mathematics we will try to give a notion of its importance and its applications. In future publications you will delve deeper into its details.
Which is the first step? Know the variability of our process.
However controlled our process is, it inevitably has a variability of the results it produces. All the pieces that come out of a line are different, all the results of a marketing campaign are different, the billing month to month is different. We can know the most important causes of this variability, estimate them very well but we will never know exactly what will happen.
We can have random behaviors (common causes), which we can represent through a statistical distribution. By accomplishing this behavior (by eliminating the systematic causes or assignable causes), we can advance in the knowledge of our process. With this we will be sure that the variability of the process follows a known distribution.

Step 2: Eliminate assignable causes.
Assignable causes must be identified and eliminated. For example, if the process produces erratic results because a machine is malfunctioning, it should be repaired. Here, this source of variability affecting the usual distribution would disappear.
Step 3: Know the distribution of common causes
It is not feasible to know what the common causes are, but its behavior can be limited to a statistical distribution. This allows for a pattern of behavior facilitating their analysis. In general, they have a normal distribution.
The distribution of common causes is characterized by 3 fundamental parameters:
Average. It is the arithmetic average of the observations.
The dispersion. The standard deviation tells us what dispersion the values of all the observations have with respect to the mean.
Symmetry. Indicates whether the distribution pattern is symmetrical with respect to the mean or biased.
What is Statistical Process Control?
It basically consists of measuring the results of the processes and determining if they are under control. That is, if the values obtained in the corresponding measurements are within the expected patterns.

There are two ways to measure the quality of processes:
One is the measurement by attributes. Here a characteristic of the product (or service) is measured and it is determined whether it is acceptable or not. It is a pass / do not pass.
The other is the measurement by variables. A process variable is continuously measured. Here, generally all variables that take continuous values (for example: length, weight, temperature, billing, profitability, number of accidents, nonconformities, etc.) appear.
How are Control Charts used?
The Control Charts are time-ordered diagrams showing the values obtained during the observation. We determine a nominal value, which we want the variable to take, which we expect.
Then two control limits are determined. A higher control edge (UCL) and a lower control edge (LCL). Its values are directly related to the statistical distribution of the variable. If the observed values fall outside these limits, we consider that our process is out of control. Assignable causes must be identified and should be eliminated.
One important thing to note is that, many times, it is good that our process goes off-limits. For example, if what we are plotting corresponds to the profitability of a company there will be no problem in having points above the UCL.
But not only with points outside the bounds can you determine that a process is out of control. There are some predefined behaviors that follow a pattern that can be considered typical of an out of control process.
Processes under control
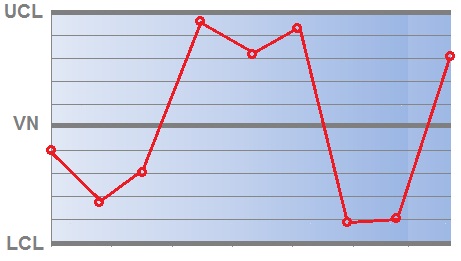
A process with normal behavior should be harmonious, with smooth variations, without exceeding the dimensions and without tendencies. For example, the following graph corresponds to a process under control:
Normal Behavior – Process under control
Out of control processes


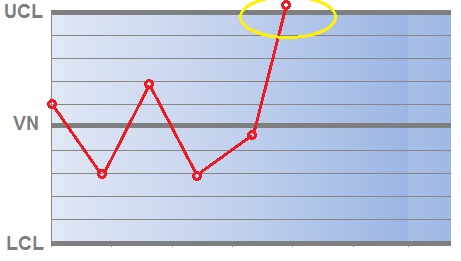


There are several cases in which (And act on it), where the process is considered to be out of control: Erratic behaviorA point outside the lower boundaryA point outside the upper boundary5 consecutive points under the centerline5 consecutive points on the centerline2 consecutive points near Of the lower limit 2 consecutive points near the upper limit 5 consecutive points with upward trend 5 consecutive points with descending tendencyErrors in useThe control charts are an excellent guidance tool about the state of our process. But they are not infallible. We may make mistakes in the criteria taken. There are two types of errors in which we can fall: Type I Errors: A good quality data set or batch (which should have been accepted) is rejected. Type II Errors: A data set or bad lot is accepted Quality (which should have been rejected).